New Old
Locks Locks
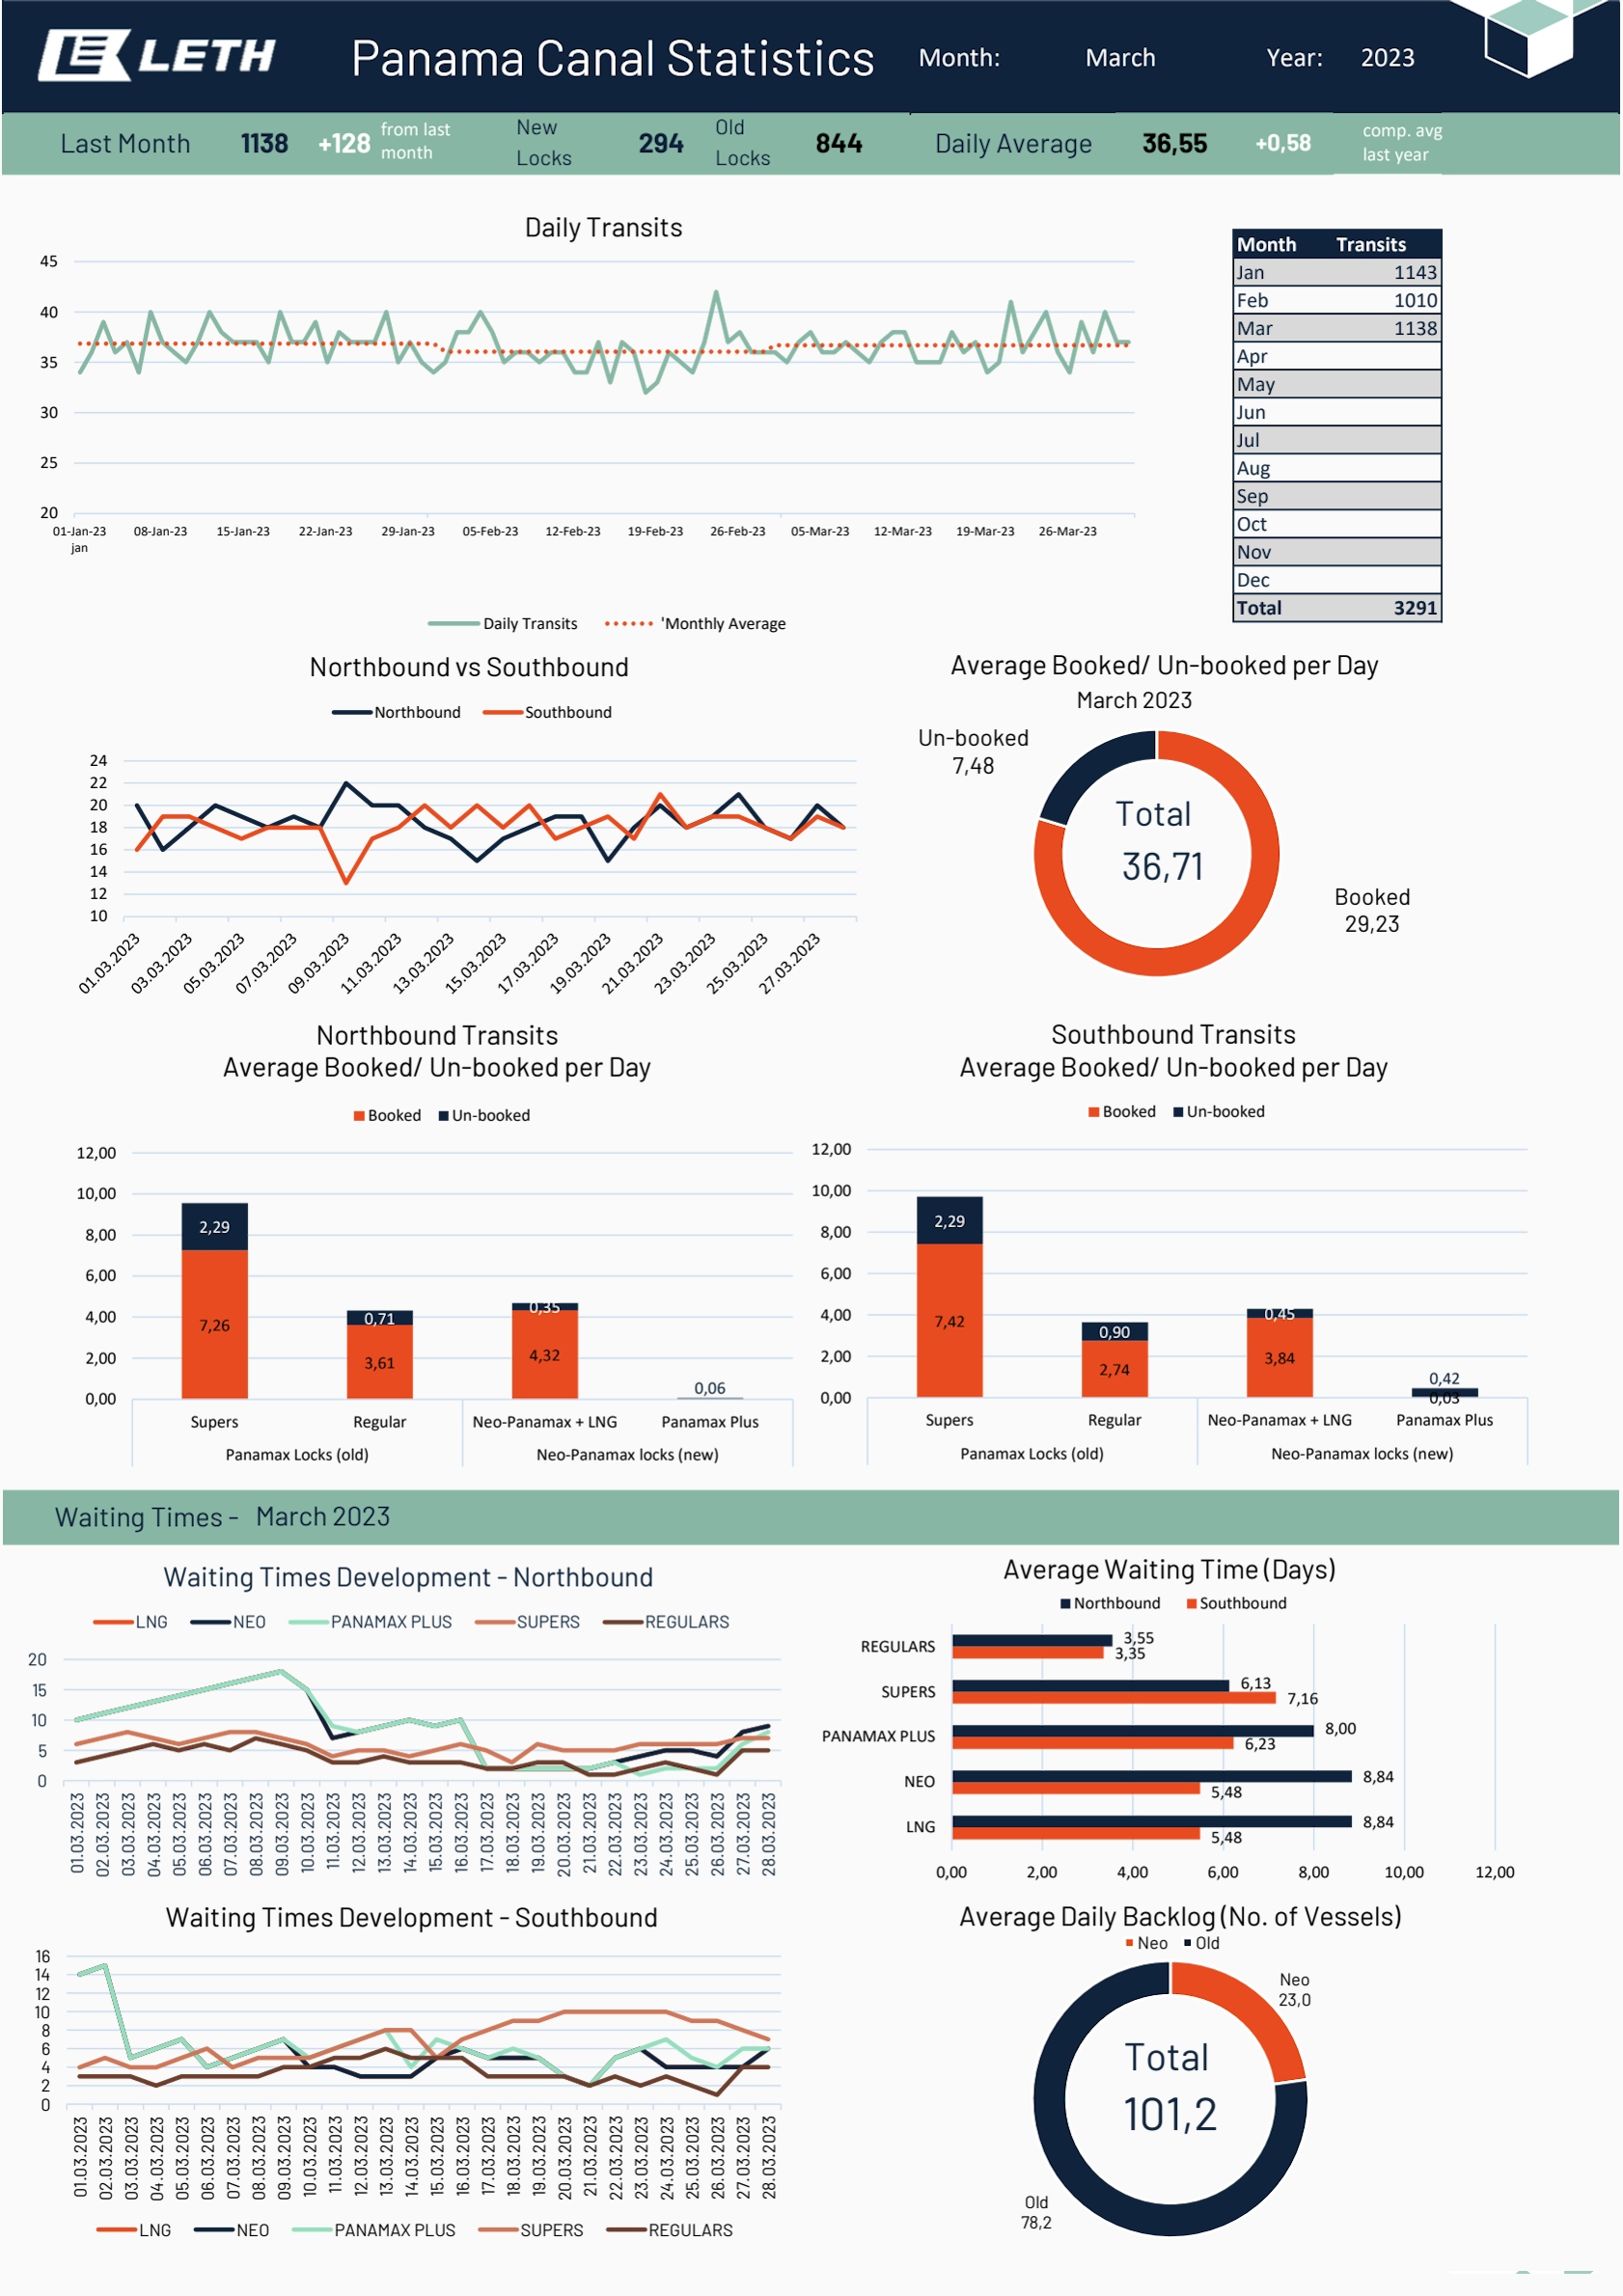
Month Transits
Jan 1143
Feb 1010
Mar 1138
Apr
May
Jun
Jul
Aug
Sep
Oct
Nov
Dec
Total 3291
Waiting Times -
2023Year:Panama Canal Statistics
36,55+0,581138Last Month +128 844294 Daily Average
Month: March
fromlast
month
comp. avg
lastyear
Neo
23,0
Old
78,2
Average Daily Backlog (No. of Vessels)
NeoOld
101,2
5,48
5,48
6,23
7,16
3,35
8,84
8,84
8,00
6,13
3,55
0,002,004,006,008,0010,0012,00
LNG
NEO
PANAMAX PLUS
SUPERS
REGULARS
Average Waiting Time (Days)
Northbound Southbound
20
25
30
35
40
45
01-Jan-23
jan
08-Jan-2315-Jan-2322-Jan-2329-Jan-2305-Feb-2312-Feb-2319-Feb-2326-Feb-2305-Mar-2312-Mar-2319-Mar-2326-Mar-23
Daily Transits
Daily Transits 'Monthly Average
7,26
3,61
4,32
2,29
0,71
0,35
0,06
0,00
2,00
4,00
6,00
8,00
10,00
12,00
Supers RegularNeo-Panamax + LNGPanamax Plus
Panamax Locks (old) Neo-Panamax locks (new)
Northbound Transits
Average Booked/ Un-booked per Day
BookedUn-booked
7,42
2,74
3,84
0,03
2,29
0,90
0,45
0,42
0,00
2,00
4,00
6,00
8,00
10,00
12,00
Supers RegularNeo-Panamax + LNGPanamax Plus
Panamax Locks (old) Neo-Panamax locks (new)
Southbound Transits
Average Booked/ Un-booked per Day
BookedUn-booked
Booked
29,23
Un-booked
7,48
Average Booked/ Un-booked per Day
36,71
10
12
14
16
18
20
22
24
Northbound vs Southbound
Northbound Southbound
Total
Total
March 2023
March 2023
0
5
10
15
20
01.03.2023
02.03.2023
03.03.2023
04.03.2023
05.03.2023
06.03.2023
07.03.2023
08.03.2023
09.03.2023
10.03.2023
11.03.2023
12.03.2023
13.03.2023
14.03.2023
15.03.2023
16.03.2023
17.03.2023
18.03.2023
19.03.2023
20.03.2023
21.03.2023
22.03.2023
23.03.2023
24.03.2023
25.03.2023
26.03.2023
27.03.2023
28.03.2023
Waiting Times Development -Northbound
LNG NEO PANAMAX PLUS SUPERS REGULARS
0
2
4
6
8
10
12
14
16
01.03.2023
02.03.2023
03.03.2023
04.03.2023
05.03.2023
06.03.2023
07.03.2023
08.03.2023
09.03.2023
10.03.2023
11.03.2023
12.03.2023
13.03.2023
14.03.2023
15.03.2023
16.03.2023
17.03.2023
18.03.2023
19.03.2023
20.03.2023
21.03.2023
22.03.2023
23.03.2023
24.03.2023
25.03.2023
26.03.2023
27.03.2023
28.03.2023
Waiting Times Development -Southbound
LNG NEO PANAMAX PLUS SUPERS REGULARS Starting bid
2023
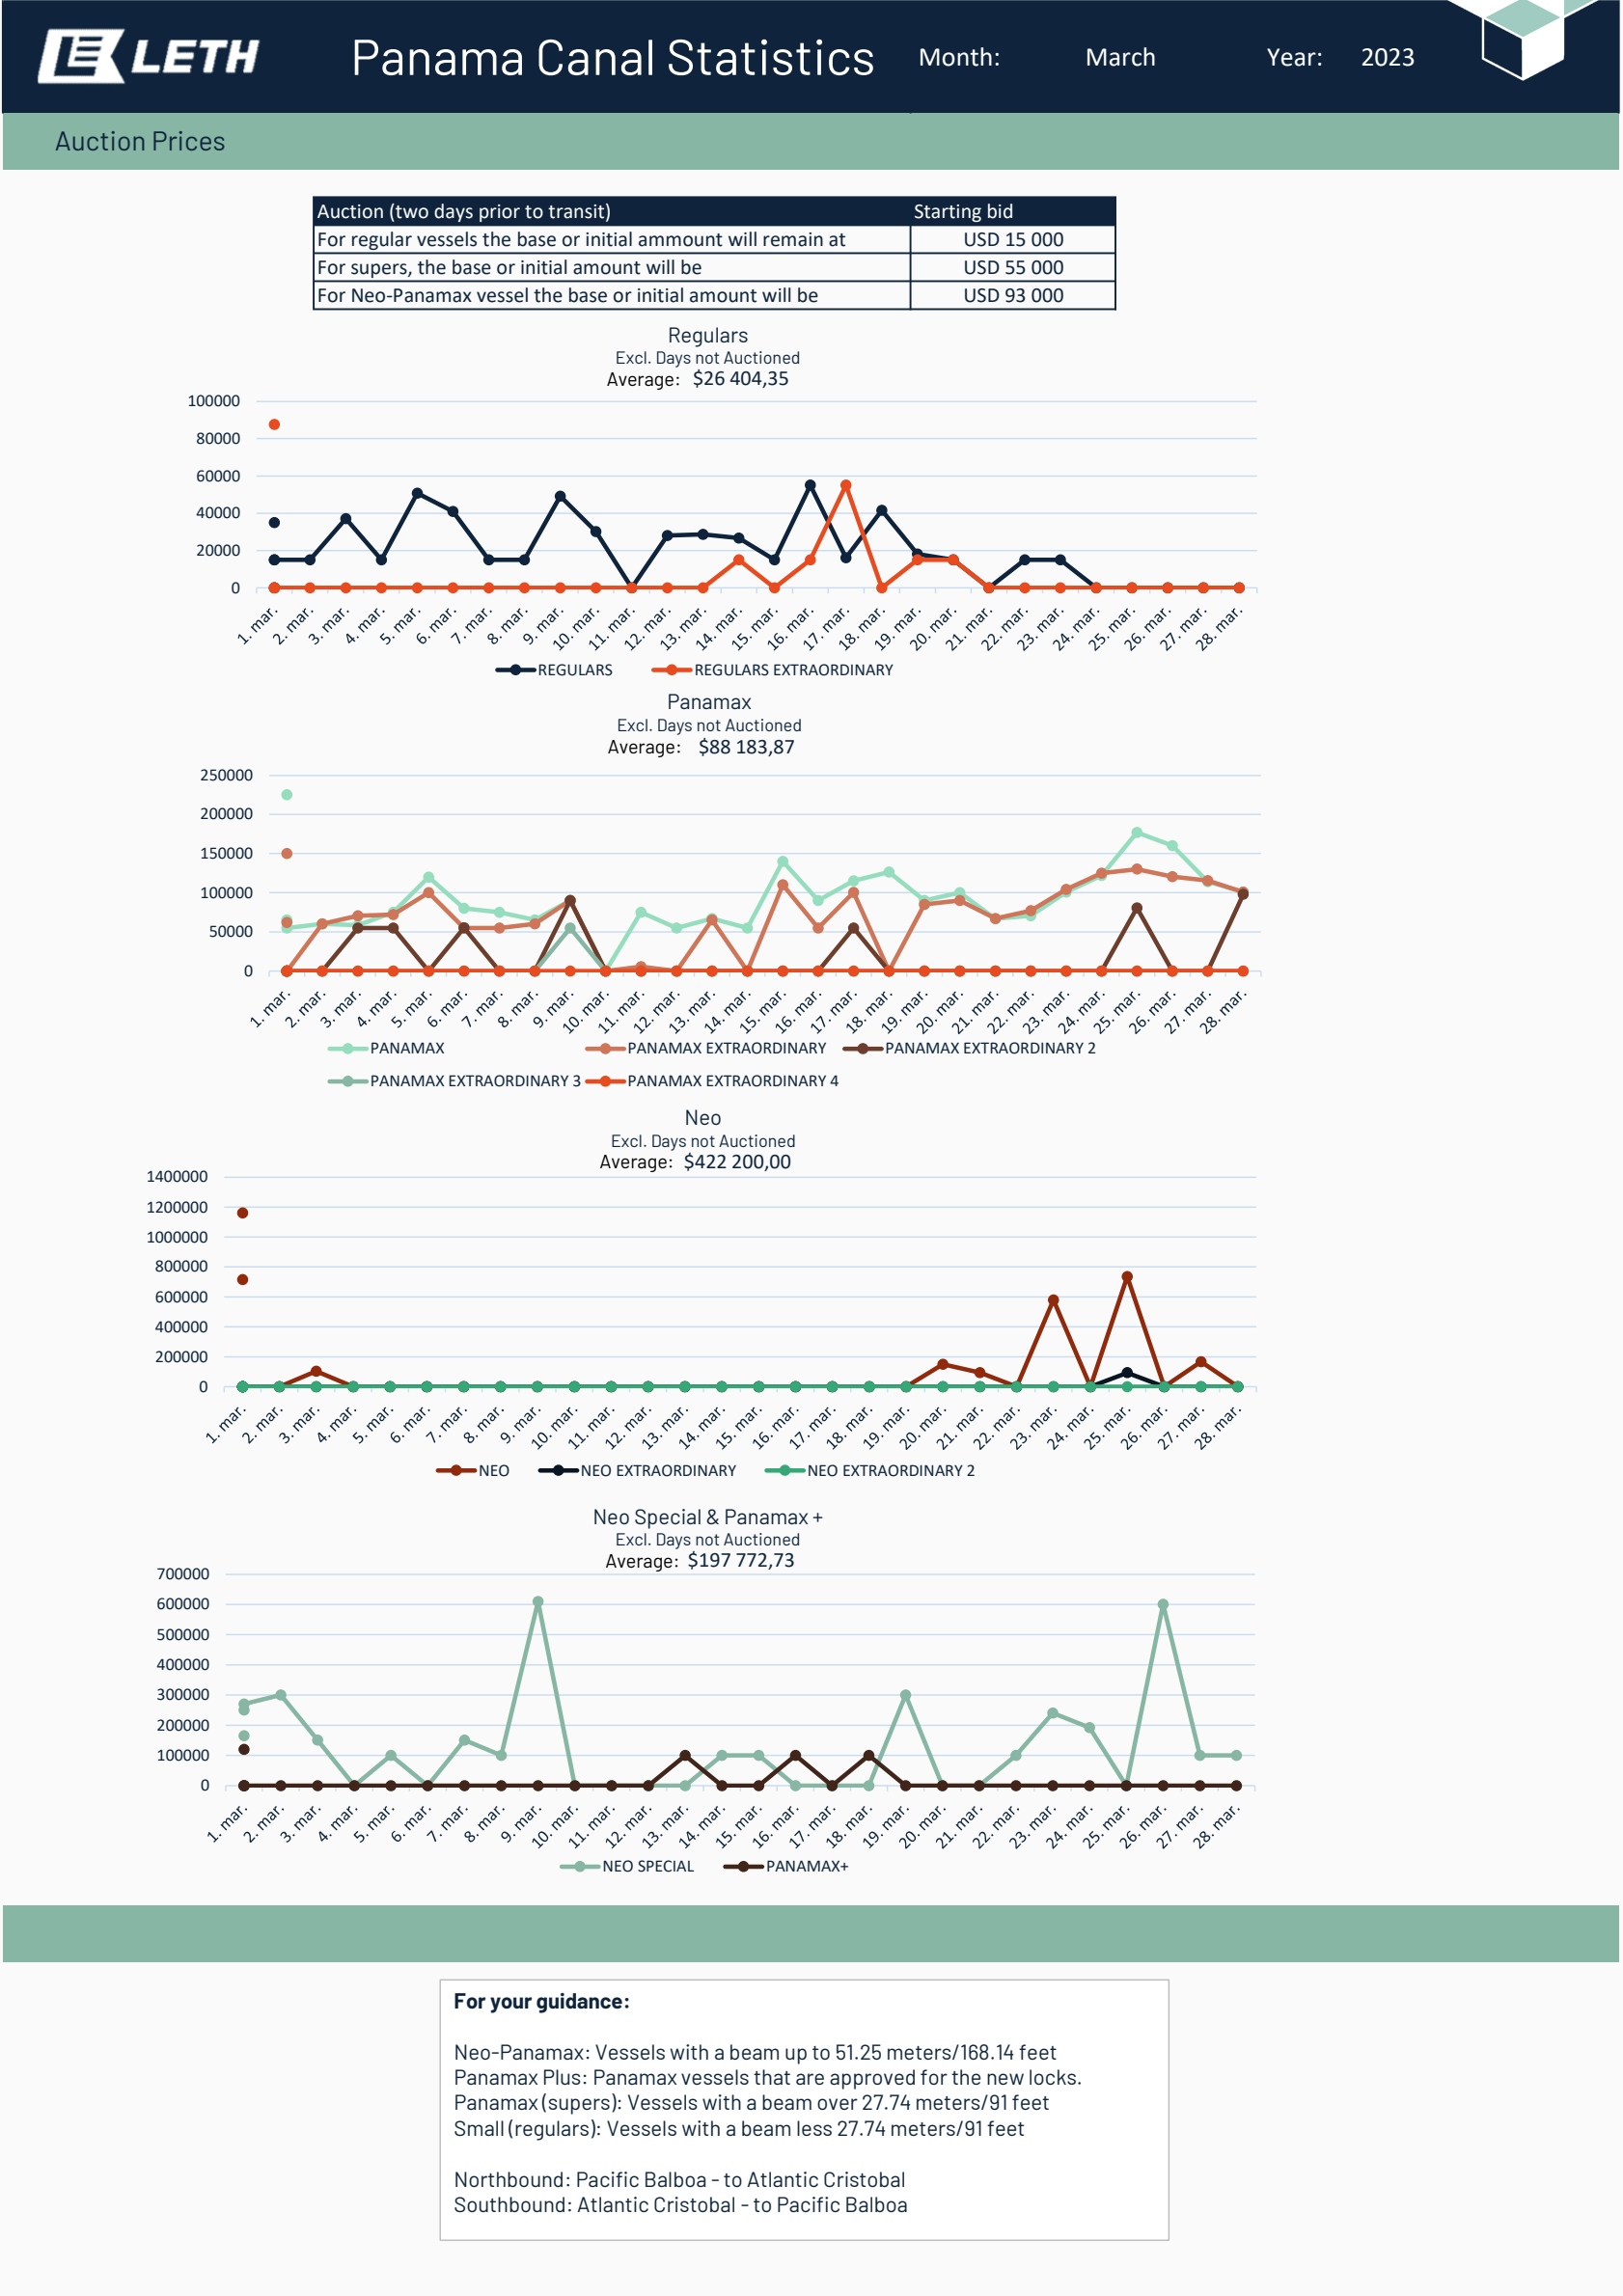
Auction Prices
Panama Canal Statistics
Year:
USD 15 000
Month: March
USD 55 000
USD 93 000
Auction (two days prior to transit)
For regular vessels the base or initial ammount will remain at
For supers, the base or initial amount will be
For Neo-Panamax vessel the base or initial amount will be
0
50000
100000
150000
200000
250000
Panamax
Excl. Days not Auctioned
PANAMAX PANAMAX EXTRAORDINARY PANAMAX EXTRAORDINARY 2
PANAMAX EXTRAORDINARY 3 PANAMAX EXTRAORDINARY 4
0
20000
40000
60000
80000
100000
Regulars
Excl. Days not Auctioned
REGULARS REGULARS EXTRAORDINARY
0
200000
400000
600000
800000
1000000
1200000
1400000
Neo
Excl. Days not Auctioned
NEO NEO EXTRAORDINARY NEO EXTRAORDINARY 2
For your guidance:
Neo-Panamax: Vessels with a beam up to 51.25 meters/168.14 feet
Panamax Plus: Panamax vessels that are approved for the new locks.
Panamax (supers): Vessels with a beam over 27.74 meters/91 feet
Small (regulars): Vessels with a beam less 27.74 meters/91 feet
Northbound: Pacific Balboa -to Atlantic Cristobal
Southbound: Atlantic Cristobal -to Pacific Balboa
0
100000
200000
300000
400000
500000
600000
700000
Neo Special & Panamax +
Excl. Days not Auctioned
NEO SPECIAL PANAMAX+
Average:
Average:
Average:
Average:
$26 404,35
$88 183,87
$422 200,00
$197 772,73
New Old
Locks Locks
Month Transits
Jan 1143
Feb 1010
Mar 1138
Apr
May
Jun
Jul
Aug
Sep
Oct
Nov
Dec
Total 3291
Waiting Times -
2023Year:Panama Canal Statistics
36,55+0,581138Last Month +128 844294 Daily Average
Month: March
fromlast
month
comp. avg
lastyear
Neo
23,0
Old
78,2
Average Daily Backlog (No. of Vessels)
NeoOld
101,2
5,48
5,48
6,23
7,16
3,35
8,84
8,84
8,00
6,13
3,55
0,002,004,006,008,0010,0012,00
LNG
NEO
PANAMAX PLUS
SUPERS
REGULARS
Average Waiting Time (Days)
Northbound Southbound
20
25
30
35
40
45
01-Jan-23
jan
08-Jan-2315-Jan-2322-Jan-2329-Jan-2305-Feb-2312-Feb-2319-Feb-2326-Feb-2305-Mar-2312-Mar-2319-Mar-2326-Mar-23
Daily Transits
Daily Transits 'Monthly Average
7,26
3,61
4,32
2,29
0,71
0,35
0,06
0,00
2,00
4,00
6,00
8,00
10,00
12,00
Supers RegularNeo-Panamax + LNGPanamax Plus
Panamax Locks (old) Neo-Panamax locks (new)
Northbound Transits
Average Booked/ Un-booked per Day
BookedUn-booked
7,42
2,74
3,84
0,03
2,29
0,90
0,45
0,42
0,00
2,00
4,00
6,00
8,00
10,00
12,00
Supers RegularNeo-Panamax + LNGPanamax Plus
Panamax Locks (old) Neo-Panamax locks (new)
Southbound Transits
Average Booked/ Un-booked per Day
BookedUn-booked
Booked
29,23
Un-booked
7,48
Average Booked/ Un-booked per Day
36,71
10
12
14
16
18
20
22
24
Northbound vs Southbound
Northbound Southbound
Total
Total
March 2023
March 2023
0
5
10
15
20
01.03.2023
02.03.2023
03.03.2023
04.03.2023
05.03.2023
06.03.2023
07.03.2023
08.03.2023
09.03.2023
10.03.2023
11.03.2023
12.03.2023
13.03.2023
14.03.2023
15.03.2023
16.03.2023
17.03.2023
18.03.2023
19.03.2023
20.03.2023
21.03.2023
22.03.2023
23.03.2023
24.03.2023
25.03.2023
26.03.2023
27.03.2023
28.03.2023
Waiting Times Development -Northbound
LNG NEO PANAMAX PLUS SUPERS REGULARS
0
2
4
6
8
10
12
14
16
01.03.2023
02.03.2023
03.03.2023
04.03.2023
05.03.2023
06.03.2023
07.03.2023
08.03.2023
09.03.2023
10.03.2023
11.03.2023
12.03.2023
13.03.2023
14.03.2023
15.03.2023
16.03.2023
17.03.2023
18.03.2023
19.03.2023
20.03.2023
21.03.2023
22.03.2023
23.03.2023
24.03.2023
25.03.2023
26.03.2023
27.03.2023
28.03.2023
Waiting Times Development -Southbound
LNG NEO PANAMAX PLUS SUPERS REGULARS Starting bid
2023
Auction Prices
Panama Canal Statistics
Year:
USD 15 000
Month: March
USD 55 000
USD 93 000
Auction (two days prior to transit)
For regular vessels the base or initial ammount will remain at
For supers, the base or initial amount will be
For Neo-Panamax vessel the base or initial amount will be
0
50000
100000
150000
200000
250000
Panamax
Excl. Days not Auctioned
PANAMAX PANAMAX EXTRAORDINARY PANAMAX EXTRAORDINARY 2
PANAMAX EXTRAORDINARY 3 PANAMAX EXTRAORDINARY 4
0
20000
40000
60000
80000
100000
Regulars
Excl. Days not Auctioned
REGULARS REGULARS EXTRAORDINARY
0
200000
400000
600000
800000
1000000
1200000
1400000
Neo
Excl. Days not Auctioned
NEO NEO EXTRAORDINARY NEO EXTRAORDINARY 2
For your guidance:
Neo-Panamax: Vessels with a beam up to 51.25 meters/168.14 feet
Panamax Plus: Panamax vessels that are approved for the new locks.
Panamax (supers): Vessels with a beam over 27.74 meters/91 feet
Small (regulars): Vessels with a beam less 27.74 meters/91 feet
Northbound: Pacific Balboa -to Atlantic Cristobal
Southbound: Atlantic Cristobal -to Pacific Balboa
0
100000
200000
300000
400000
500000
600000
700000
Neo Special & Panamax +
Excl. Days not Auctioned
NEO SPECIAL PANAMAX+
Average:
Average:
Average:
Average:
$26 404,35
$88 183,87
$422 200,00
$197 772,73